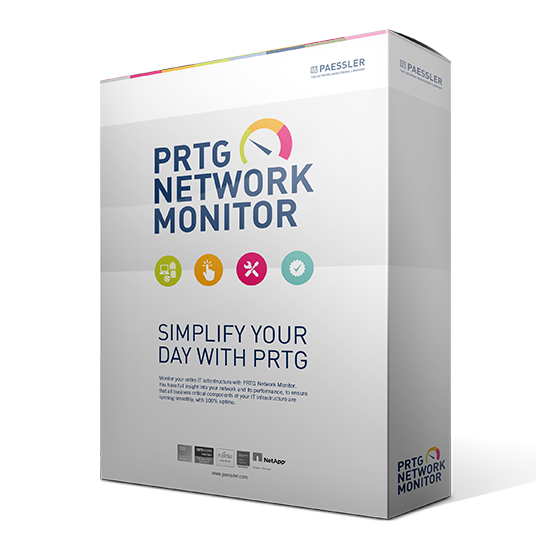
PRTG Network Monitor covers all aspects of network monitoring including, up-/downtime monitoring, traffic and usage monitoring, SNMP, NetFlow and packet sniffing, combined with concise reporting and analysis features.
PRTG Network Monitor is a network monitoring tool that assures the availability of network components and measures traffic and use. PRTG Network Monitor includes more than 150 sensor types for all common network services, including HTTP, SMTP/POP3 (email), FTP, etc. We can alert users to outages before their users even notice them, including via email, SMS, or pager. Even better, after users use PRTG to track request times and uptime for a few months, you can optimise your network such that the pager never rings again.
PRTG Network Monitor runs on a Windows machine within your network, collecting various statistics from the machines, software and devices which you designate. It also retains the data so you can see historical performance, helping you react to changes. PRTG comes with an easy-to-use web interface with point-and-click configuration. Easily share data from it with non-technical colleagues and customers, including via live graphs and custom reports.
PRTG Network Monitor benefits:
- Avoid performance bottlenecks and proactively deliver better quality of service.
- Reduce costs by buying according to needs and increase profits by minimising downtime.
- Find peace of mind: No alarms from PRTG means that everything is running fine.
- Single Page Application web interface. All object setting dialogues are shown as pop-up layers, so you never lose the current context when changing the tag of an object or adding a notification trigger.
PRTG Network Monitor - Features
Key Features:
Quick Download, Installation and Configuration
- Quick ad-hoc Download (179 MB): no web forms or registration hassles
- Runs on all Windows versions (Windows 7 or later): server or workstation, 32 or 64 bit
- Installs in 3 minutes: no additional downloads (.NET, SQL Server etc.) required
Easy to Use: Choose Between Several User Interfaces
- Full featured web browser based Interface: state of the art, AJAX based web site
- HTML only, minimalistic web browser based interface (feature limited) for older browsers and mobile devices (runs on IE 6/7/8, iOS, Android, Blackberry, Windows Phone)
- Enterprise Console: Native Windows application especially for large installations. Supports viewing monitoring data of several PRTG installations in one single application.
Comprehensive Network Monitoring
- More than 200 sensor types covering all aspects of network monitoring
- Uptime/Downtime Monitoring
- Bandwidth Monitoring using SNMP, WMI, NetFlow, sFlow, jFlow, Packet Sniffing
Flexible Alerting
- 10 notification technologies: Send Email, Push message, SMS/Pager, Syslog and SNMP Trap, HTTP request, Event log entry, Play alarm sound files, Amazon SNS, any external technology that can be triggered by an EXE or batch file
- Push notifications are available for free and included in every PRTG license. Receive push messages from PRTG directly in the notification area of your Android or iOS mobile device!
PRTG Cluster Failover Solution
- In a PRTG Cluster up to 5 PRTG instances ("Nodes") work together to create a failover tolerant monitoring system.
- Not even a software update causes downtime for a PRTG cluster.
- The cluster performs automatic failovers: If the primary node fails or loses connection to the cluster, another node immediately becomes the master server and takes over the sending of notifications.
Distributed Monitoring Using Remote Probes
With the so called Remote Probes PRTG Network Monitor can be used to monitor several networks in different locations:
- Monitor all subsidiaries from the headquarter
- Monitor separated networks within your company (e.g. DMZ and LAN)
- As MSP you can monitor your customer's networks and increase the quality of service
All you need is one central installation of the PRTG Core Server. Each PRTG license includes unlimited Remote Probes.
Data Publishing and Maps
- Real time dashboards with live performance and status information
- Private and public dashboards: e.g. screens for network operations centers or maps with at-a-glance information for other employees
- Interactive map designer with more than 300 different map objects (network icons, status icons, traffic charts, top 10 lists, etc.)
In-Depth Reporting
- Reports in HTML or PDF format
- Reporting tasks can be run ad-hoc or scheduled (daily, weekly, monthly)
- Historic monitoring data can be exported as HTML, XML, CSV
High Performance Design and High Security Standards
- PRTG supports monitoring from 1 up to thousands of sensors per installation (Please see recommended setup for most PRTG users)
- Paessler's proprietary database system is highly optimised for monitoring data (data is accessible thr
PRTG Network Monitor - System Requirements
Recommended Setup for Most PRTG Users
We recommend that you run the PRTG core server as well as all remote probes:
- directly on x64 PC/server hardware (not older than 2 years)
- under Windows Server 2012 R2 having .NET Framework 4.0 or 4.5 installed.
The following Windows versions are officially supported for PRTG "Core Service" and "Probe Service". We recommend 64-bit (x64) operating systems.
- Microsoft Windows Server 2012 R2* (recommended)
- Microsoft Windows Server 2012*
- Microsoft Windows 10
- Microsoft Windows 8.1
- Microsoft Windows 8
- Microsoft Windows 7
- Windows Server 2008 R2
- Microsoft Windows Server 2008 (not recommended)
- Microsoft Windows Vista (not recommended).
* Windows Server 2012 in Core mode and the Minimal Server Interface are not officially supported.
PRTG Web Interface
The following browsers are officially supported for the web browser based primary user interface of PRTG (in order of performance and reliability) at screen resolution of 1024x768 pixels (more recommended):
- Google Chrome 49 or later (recommended)
- Mozilla Firefox 45 or later
- Microsoft Internet Explorer 11
- Other and older browsers may not be able to access to the WebUI at all.
PRTG Windows App (Enterprise Console): The PRTG Enterprise Console app runs under all supported Windows versions (see the list above) at screen resolutions of 1024x768 pixels or more.
Requirements for Monitored Devices
- SNMP monitoring: The monitored device(s) must be equipped with SNMP Version 1, 2c, or 3 (an SNMP-compatible software must be installed on the device). SNMP must be enabled on the device and the machine running PRTG must be allowed to access to the SNMP interface. For details, please see PRTG Manual: Monitoring via SNMP
- Windows/WMI monitoring: To use WMI (Windows Management Instrumentation) monitoring, you need a Windows network. Host PC and client PCs with Windows OS as given above are officially supported. Please do not use Windows Vista or Windows Server 2008 on hosts PCs for WMI monitoring, both have WMI performance issues. For details, please see PRTG Manual: Monitoring via WMI
- NetFlow, IPFIX, sFlow, jFlow monitoring: The device must be configured to send NetFlow (V5, V9, or IPFIX), sFlow (V5), jFlow (V5) data packets to the machine running a PRTG probe. For details, please see PRTG Manual: Monitoring Bandwidth via Flows
- Packet Sniffing: Only data packets passing the network card of the local machine can be analysed. Switches with so-called "monitoring ports" are necessary for network-wide monitoring in switched networks. For details, please see PRTG Manual: Monitoring Bandwidth via Packet Sniffing

